Showing posts with label Engineering. Show all posts

Tuesday, November 21, 2017

General Motors funds engineering education based on Energy3D

Designing a parking lot solar canopy at Detroit Airport
General Motors (GM), along with other RE100 companies, has committed to powering its worldwide factories and offices with 100% renewable energy by 2050. Last month, the company furthered its commitment by giving the Engineering Computation Team at the Concord Consortium a $200,000 grant to promote engineering education using renewable energy as a learning context and artificial intelligence as a teaching assistant.

Modeling GM's rooftop solar arrays in Baltimore, MD
Modeling GM's solar arrays in Warren, MI
The project will use our signature Energy3D software, which is a one-stop-shop CAD tool for designing and simulating all kinds of solar power systems including photovoltaic (PV) and concentrated solar power (CSP), both of which have reached a very competitive cost of merely 5¢ per kWh or below in the world market. A unique feature of Energy3D is its ability to collect and analyze "atomically" fine-grained process data while users are designing with it. This capability makes it possible for us to develop machine learning algorithms to understand users' design behaviors, based on which we can develop intelligent agents to help users design better products and even unleash their creativity.

The generous grant from GM will allow us to bring this incredible engineering learning tool and the curriculum materials it supports to more science teachers across New England. It will also help extend our fruitful collaboration with the Virtual High School (VHS) to convert our Solarize Your World curriculum into an online course for sustainable engineering. VHS currently offers more than 200 titles to over 600 member schools. Through their large network, we hope to inspire and support more students and teachers to join the crucial mission that GM and other RE100 companies are already undertaking.

By supporting today's students to learn critical engineering design skills needed to meet the energy and environmental challenges, GM is setting an example of preparing tomorrow's workforce to realize its renewable energy vision.

Saturday, November 4, 2017

Energy3D allows users to select brand name solar panels

Fig. 1: 20 brand name solar panels in Energy3D
Fig. 2: The daily outputs of 20 types of solar panels
Previous versions of Energy3D were based on a generic model of solar panel, which users can set its properties such as solar cell type, peak efficiency, panel dimension, color, nominal operating cell temperature, temperature coefficient of power, and so on. While it is essential for users to be able to adjust these parameters and learn what they represent and how they affect the output, it is sometimes inconvenient for a designer to manually set the properties of a solar panel to those of a brand name.

Fig. 3: The Micky Mouse solar farm
From Version 7.4.4, I started to add support of brand name solar panels to Energy3D. Twenty brand names were initially added to this version (Figure 1). These models are: ASP-400M (Advanced Solar Photonics), CS6X-330M-FG (Canadian Solar), CS6X-330P-FG (Canadian Solar), FS-4122-3 (First Solar), HiS-M280MI (Hyundai), HiS-S360RI (Hyundai), JAM6(K)-60-300/PR (JA Solar), JKM300M-60 (Jinko), LG300N1C-B3 (LG), LG350Q1K-A5 (LG), PV-UJ235GA6 (Mitsubishi), Q.PRO-G4 265 (Q-cells), SPR-E20-435-COM (SunPower), SPR-P17-350-COM (SunPower), SPR-X21-335-BLK (SunPower), SPR-X21-345 (SunPower), TSM-325PEG14(II) (Trina Solar), TSM-365DD14A(II) (Trina Solar), VBHN330SA16 (Panasonic), and YL305P-35b (Yingli). Figure 2 shows a comparison of their daily outputs in Boston on June 22 when they are laid flat (i.e., with zero tilt angle). Not surprisingly, a smaller solar panel with a lower cell efficiency produces less electricity.

Note that these models are relatively new. There are hundreds of older and other types of solar panels that will take a long time to add. If your type is not currently supported, you can always fall back to defining it using the "Custom" option, which is the default model for a solar panel.

Adding these brand names helped me figure out that the solar panels deployed in the Micky Mouse Solar Farm in Orlando (Figure 3) are probably from First Solar -- only they make solar panels of such a relatively small size (1200 mm × 600 mm).

Tuesday, September 26, 2017

The challenge to solarize the world

More and more nations and regions in the world are planning to switch their power supplies to 100% renewable resources by midcentury. There has been, however, a well-publicized debate among scientists about the feasibility of powering the entire United States with only wind, water, and solar energy, triggered mostly by a recent paper by Stanford professor Mark Jacobson and colleagues. Both proponents and opponents are leading energy researchers who support their claims with sophisticated computational models. Given the magnitude and complexity of the problem, there will likely be no clear winner in the near future. But the debate will continue to influence our energy and environmental policies in the years to come.

Since the world also belongs to the young, we are obliged to find a way to engage them in this high-stakes debate. Regardless of the sides people take, few would dispute the strategic importance of educating and preparing energy consumers and workforce of tomorrow. Motivating youth is so vital in Bill Gates’ call for an “energy miracle” that he urged high school students to “get involved” in the energy quest in his 2016 annual letter. But, apart from becoming a conscientious user of energy, how can students make meaningful contributions?

Fig. 1: Energy3D covers nearly 600 regions in 185 countries.
We envision a cyberinfrastructure that works like an “Energy Minecraft” to inspire and support millions of students to take on the energy challenge at the grassroots level on a global scale. On this platform, students will learn basic science concepts and engineering principles. Equipped with the knowledge and skills, they will then crowd-design an unprecedentedly fine-grained computational model that consists of millions of virtual solar panels, reflecting mirrors, and wind turbines accurately positioned around the world and connected to virtual storages and grids. A multiscale model with all these low-level details does not exist yet, but it may be a holy grail in energy research that can potentially settle the case and even provide a blueprint going forward to a 100% renewable energy future if possible at all.

This article introduces the Solarize Your World program, the first step towards realizing the above vision. Although the program currently focuses on solar energy, it has the essential elements of a computational model capable of supporting both STEM education and energy research. And it can be extended to include other renewables such as wind, hydroelectric, and geothermal energy.

The complexity of modeling solar power in the real world

Fig. 2: Learn, apply, and explore
The sun is a gigantic nuclear fusion reactor in the sky that emits a massive amount of energy. Elon Musk has famously asserted that covering “a fairly small corner” of a state like Nevada with solar panels can generate enough energy for the whole country. This makes you wonder what scientists are really debating about.

It turns out that building a reliable solar infrastructure is not as simple as laying down billions of solar panels in a square of 100×100 miles. There are countless technical, economic, and social constraints for solar deployment in reality. For example, people do not have unlimited space and budgets. Some are concerned about the aesthetics of buildings and landscapes with solar panels in sight. Governmental policies drive the cost of solar energy, hence people’s interest, up and down. Energy storage is needed to overcome solar intermittency to provide electricity after sun-set and grid stability at all time. A significant amount of energy is lost during the transmission from utility-scale solar power plants to population centers. All things considered, we have a problem far more complicated than Musk’s ballpark statement. This is why the National Renewable Energy Laboratory has been conducting research on estimating the solar energy potential of the country (e.g., see "Rooftop Solar Photovoltaic Technical Potential in the United States: A Detailed Assessment" by Pieter Gagnon, Robert Margolis, Jennifer Melius, Caleb Phillips, and Ryan Elmore in 2016).

A crowdsourcing model that integrates education and research

Fig. 3: Photovoltaic solar farms in Energy3D
A more accurate assessment of the planet’s true solar potential is to identify all possible locations where suitable types of solar power can be realistically deployed and compute their minute-by-minute outputs to global grids and storages for a cycle of 24 hours under typical meteorological conditions. To evaluate the cost effectiveness of this giant distributed network, a mix of financing models driven by local economics and policies can be used to estimate the scale of investment that needs to be made over a certain period of time. Creating such a multiscale, time-dependent model with details down to instantaneous outputs and levelized costs of individual solar modules is a daunting task that no single researcher can do. But we can call for help from millions of students who know and care about their corners of the world more than any outsider. The challenge is to teach them the science and empower them with appropriate engineering tools so that they can join the energy quest.

Solarize Your World is based on our Energy3D software, a revolutionary CAD tool for anyone to design any type of solar power system in cyberspace and calculate its hourly, daily, or yearly out-puts based on numerical simulation from first principles. With weather data of nearly 600 regions in 185 countries (Figure 1), Energy3D can produce satisfactory results for most parts of the inhabited world, enabling millions to work on local projects. The ultimate goal of Energy3D is to turn the tedious job of engineering design into a fun game like Minecraft, making learning, discovery, and invention playful experiences for all.

A curriculum for learning and practicing science and engineering

Fig. 4: Concentrated solar power plants in Energy3D
For students to succeed in creating authentic models of solar energy systems valuable to research, Solarize Your World provides comprehensive curriculum materials and classroom-to-afterschool pathways (Figure 2) that lead students to: 1) design solar energy systems for their homes, schools, villages, and cities; 2) design any type of photovoltaic and concentrated solar power plants wherever applicable; and 3) communicate their designs to potential stakeholders whenever appropriate. Figures 3 and 4 show solar power systems of different types and sizes on top of satellite images of the chosen sites from Google Maps (some of these systems were modeled or designed by students in our 2017 pilot tests).

The Solarize Your World curriculum consists of three connected parts. Part I teaches students the needed disciplinary core ideas, crosscutting concepts, and science and engineering practices as defined in the Next Generation Science Standards. The disciplinary core ideas cover earth science, heat transfer, geometric optics, and electric circuits that are fundamental to solar power. The crosscutting concepts include energy and systems that are necessary to understanding how the energy from the sun can be converted into electricity to power the world. This part also strives to familiarize students with the practices of scientific inquiry and engineering design. Part II provides scores of open-ended, real-world projects for students to choose. For instance, students can design solar energy systems for their own homes or schools. If students cannot finish a project within the given timeframe in the classroom or wish to undertake more projects out of school, Part III supports them to continue in an online community, possibly in collaboration with many other participants similar to the case of Minecraft.

The road ahead

The U.S. Department of Energy announced on September 12, 2017 that the 2020 utility-scale solar cost goal set by its SunShot Initiative had been met three years earlier. The price of utility-scale solar energy has now fallen to six cents per kilowatt hour. Despite this phenomenal plummet, the road to a 100% renewable energy future is still unclear and debatable. We invite students and teachers worldwide to join our Solarize Your World initiative to pave the way. Rarely have students been given a chance to help answer a question so crucial to humanity.

Thursday, September 14, 2017

Deciphering a solar array surprise with Energy3D

Fig. 1: An Energy3D model of the SAS solar farm
Fig. 2: Daily production data (Credit: Xan Gregg)
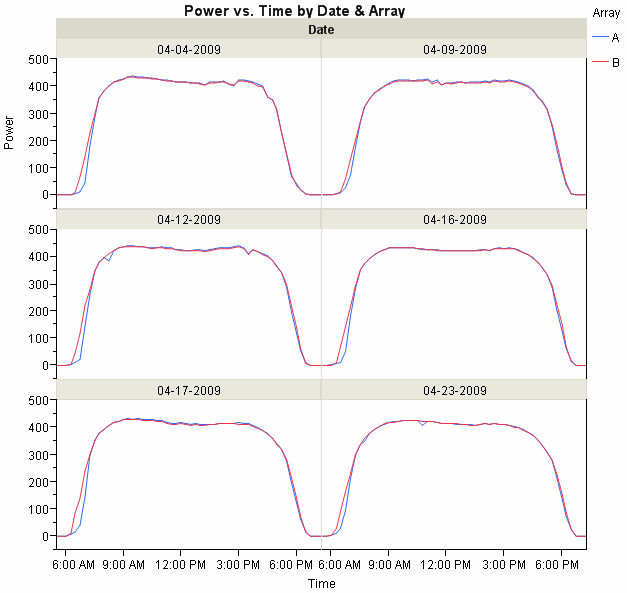
SAS, a software company based in Cary, NC, is powered by a solar farm consisting of solar panel arrays driven by horizontal single-axis trackers (HSAT) with the axis fixed in the north-south direction and the panels rotating from east to west to follow the sun during the day. Figure 1 shows an Energy3D model of the solar farm. Xan Gregg, JMP Director of Research and Development at SAS, posted some production data from the solar farm that seem so counter-intuitive that he called it a "solar array surprise" (which happens to also acronym to SAS, by the way).

The data are surprising because they show that the outputs of solar panels driven by HSAT actually dip a bit at noon when the intensity of solar radiation reaches the highest of the day, as shown in Figure 2. The dip is much more pronounced in the winter than in the summer, according to Mr. Gregg (he only posted the data for April, though, which shows a mostly flat top with a small dip in the production curve).

Fig. 3: Energy3D results for four seasons.
Anyone can easily confirm this effect with an Energy3D simulation. Figure 3 shows the results predicted by Energy3D for 1/22, 4/22, 7/22, and 10/22, which reveal a small dip in April, significant dips in January and October, and no dip at all in July. How do we make sense of these results?

Fig. 4: Change of incident sunbeam angle on 1/22 (HSAT).
One of the most important factors that affect the output of solar panels, regardless of whether or not they turn to follow the sun, is the angle of incidence of sunlight (the angle between the direction of the incident solar rays and the normal vector of the solar panel surface). The smaller this angle is, the more energy the solar panel receives (if everything else is the same). If we track the change of the angle of incidence over time for a solar panel rotated by HSAT on January 22, we can see that the angle is actually the smallest in early morning and gradually increases to the maximum at noon (Figure 4). This is opposite to the behavior of the change of the angle of incidence on a horizontally-fixed solar panel, which shows that the angle is the largest in early morning and gradually decreases to the minimum at noon (Figure 5). The behavior shown in Figure 5 is exactly the reason why we feel the solar radiation is the most intense at noon.

Fig. 5: Change of incident sunbeam angle on 1/22 (fixed)
If the incident angle of sunlight is the smallest at 7 am in the morning of January 22, as shown in Figure 4, why is the output of the solar panels at 7 am less than that at 9 am, as shown in Figure 3? This has to do with something called air mass, a convenient term used in solar engineering to represent the distance that sunlight has to travel through the Earth's atmosphere before it reaches a solar panel as a ratio relative to the distance when the sun is exactly vertically upwards (i.e. at the zenith). The larger the air mass is, the longer the distance sunlight has to travel and the more it is absorbed or scattered by air molecules. The air mass coefficient is approximately inversely proportional to the cosine of the zenith angle, meaning that it is largest when the sun just rises from the horizon and the smallest when the sun is at the zenith. Because of the effect of air mass, the energy received by a solar panel will not be the highest at dawn. The exact time of the output peak depends on how the contributions from the incidental angle and the air mass -- among other factors -- are, relatively to one another.

So we can conclude that it is largely the motion of the solar panels driven by HSAT that is responsible for this "surprise." The constraint of the north-south alignment of the solar panel arrays makes it more difficult for them to face the sun, which appears to be shining more from the south at noon in the winter.

If you want to experiment further, you can try to track the changes of the incident angle in different seasons. You should find that the change of angle from morning to noon will not change as much as the day moves to the summer.

This dip effect becomes less and less significant if we move closer and closer to the equator. You can confirm that the effect vanishes in Singapore, which has a latitude of one degree. The lesson learned from this study is that the return of investment in HSAT is better at lower latitudes than at higher latitudes. This is probably why we see solar panel arrays in the north are typically fixed and tilted to face the south.

The analysis in this article should be applicable to parabolic troughs, which follow the sun in a similar way to HSAT.

Tuesday, August 1, 2017

Modeling parabolic dish Stirling engines in Energy3D

Fig. 1: A parabolic dish Stirling engine
Fig. 2: The Tooele Army Depot solar project in Utah
A parabolic dish Stirling engine is a concentrated solar power (CSP) generating system that consists of a stand-alone parabolic dish reflector focusing sunlight onto a receiver positioned at the parabolic dish's focal point. The dish tracks the sun along two axes to ensure that it always faces the sun for the maximal input (for photovoltaic solar panels, this type of tracker is typically known as dual-axis azimuth-altitude tracker, or AADAT). The working fluid in the receiver is heated to 250–700 °C and then used by a Stirling engine to generate power. A Stirling engine is a heat engine that operates by cyclic compression and expansion of air or other gas (the working fluid) at different temperatures, such that there is a net conversion of thermal energy to mechanical work. The amazing Stirling engine was invented 201 years ago(!). You can see an infrared view of a Stirling engine at work in a blog article I posted early last year.

Although parabolic dish systems have not been deployed at a large scale -- compared with its parabolic trough cousin and possibly due to the same reason that AADAT is not popular in photovoltaic solar farms because of its higher installation and maintenance costs, they nonetheless provide solar-to-electric efficiency above 30%, higher than any photovoltaic solar panel in the market as of 2017.

In Version 7.2.2 of Energy3D, I have added the modeling capabilities for designing and analyzing parabolic dish engines (Figure 1). Figure 2 shows an Energy3D model of the Tooele Army Depot project in Utah. The solar power plant consists of 429 dishes, each having an aperture area of 35 square meters and outputting 3.5 kW of power.

Fig. 3: All four types of real-world CSP projects modeled in Energy3D
With this new addition, all four types of main CSP technologies -- solar towers, linear Fresnel reflectors, parabolic troughs, and parabolic dishes, have been supported in Energy3D (Figure 3). Together with its advancing ability to model photovoltaic solar power, these new features have made Energy3D one of the most comprehensive and powerful solar design and simulation software tools in the world, delivering my promise made about a year ago to model all major solar power engineering solutions in Energy3D.

An afterthought: We can regard a power tower as a large Fresnel version of a parabolic dish and the compact linear Fresnel reflectors as a large Fresnel version of a parabolic trough. Hence, all four concentrated solar power solutions are based on parabolic reflection, but with different nonimaging optical designs that strike the balance between cost and efficiency.

Thursday, July 20, 2017

Analyzing the linear Fresnel reflectors of the Sundt solar power plant in Tuscon

Fig. 1: The Sundt solar power plant in Tuscon, AZ
Fig. 2: Visualization of incident and reflecting light beams
Tucson Electric Power (TEP) and AREVA Solar constructed a 5 MW compact linear Fresnel reflector (CLFR) solar steam generator at TEP’s H. Wilson Sundt Generating Station -- not far from the famous Pima Air and Space Museum. The land-efficient, cost-effective CLFR technology uses rows of flat mirrors to reflect sunlight onto a linear absorber tube, in which water flows through, mounted above the mirror field. The concentrated sunlight boils the water in the tube, generating high-pressure, superheated steam for the Sundt Generating Station. The Sundt CLFR array is relatively small, so I chose it as an example to demonstrate how Energy3D can be used to design, simulate, and analyze this type of solar power plant. This article will show you how various analytic tools built in Energy3D can be used to understand a design principle and evaluate a design choice.

Fig. 3: Snapshots
One of the "strange" things that I noticed from the Google Maps of the power station (the right image in Figure 1) is that the absorber tube stretches out a bit at the northern edge of the reflector assemblies, whereas it doesn't at the southern edge. The reason that the absorber tube was designed in such a way becomes evident when we turn on the light beam visualization in Energy3D (Figure 2). As the sun rays tend to come from the south in the northern hemisphere, the focal point on the absorber tube shifts towards the north. During most days of the year, the shift decreases when the sun rises from the east to the zenith position at noon and increases when the sun lowers as it sets to the west. This shift would have resulted in what I call the edge losses if the absorber tube had not extended to the north to allow for the capture of some of the light energy bounced off the reflectors near the northern edge. This biased shift becomes less necessary for sites closer to the equator.

Energy3D has a way to "run the sun" for the selected day, creating a nice animation that shows exactly how the reflectors turn to bend the sun rays to the absorber pipe above them. Figure 3 shows five snapshots of the reflector array at 6am, 9am, 12pm, 3pm, and 6pm, respectively, on June 22 (the longest day of the year).

As we run the radiation simulation, the shadowing and blocking losses of the reflectors can be vividly visualized with the heat map (Figure 4). Unlike the heat maps for photovoltaic solar panels that show all the solar energy that hits them, the heat maps for reflectors show only the reflected portion (you can choose to show all the incident energy as well, but that is not the default).

There are several design parameters you can explore with Energy3D, such as the inter-row spacing between adjacent rows of reflectors. One of the key questions for CLFR design is: At what height should the absorber tube be installed? We can imagine that a taller absorber is more favorable as it reduces shadowing and blocking losses. The problem, however, is that, the taller the absorber is, the more it costs to build and maintain. It is probably also not very safe if it stands too tall without sufficient reinforcements. So let's do a simulation to get in the ballpark. Figure 5 shows the relationship between the daily output and the absorber height. As you can see, at six meters tall, the performance of the CLFR array is severely limited. As the absorber is elevated, the output increases but the relative gain decreases. Based on the graph, I would probably choose a value around 24 meters if I were the designer.
Fig. 4: Heat map visualization

An interesting pattern to notice from Figure 5 is a plateau (even a slight dip) around noon in the case of 6, 12, and 18 meters, as opposed to the cases of 24 and 30 meters in which the output clearly peaks at noon. The disappearance of the plateau or dip in the middle of the output curve indicates that the output of the array is probably approaching the limit.

Fig. 5: Daily output vs. absorber height
If the height of the absorber is constrained, another way to boost the output is to increase the inter-row distance gradually as the row moves away from the absorber position. But this will require more land. Engineers are always confronted with this kind of trade-offs. Exactly which solution is the optimal depends on comprehensive analysis of the specific case. This level of analysis used to be a professional's job, but with Energy3D, anyone can do it now.

Saturday, July 15, 2017

Modeling linear Fresnel reflectors in Energy3D

Fig. 1: Fresnel reflectors in Energy3D.
Fig. 2: An array of linear Fresnel reflectors
Linear Fresnel reflectors use long assemblies of flat mirrors to focus sunlight onto fixed absorber pipes located above them, thus capable of concentrating sunlight to as high as 30 times of its original intensity (Figures 1 and 2). This concentrated light energy is then converted into thermal energy to heat a fluid in the pipe to a very high temperature. The hot fluid gives off the heat through a heat exchanger to power a steam generator, like in other concentrated solar power plants such as parabolic troughs and power towers.

Fig. 3: Heap map view of reflector gains
Compared with parabolic troughs and power towers, linear Fresnel reflectors may be less efficient in generating electricity, but they may be cheaper to build. According to Wikipedia and the National Renewable Energy Laboratory, Fresnel reflectors are the third most used solar thermal technology after parabolic troughs and power towers, with about 15 plants in operation or under construction around the world. To move one small step closer to our goal of providing everyone a one-stop-shop solar modeling software program for solarizing the world, I have added the design, simulation, and analysis capabilities of this type of concentrated solar power technology in Version 7.1.8 of Energy3D.

Fig. 4: Compact linear Fresnel reflectors.
Fig. 5: Heat map view of linear Fresnel reflectors for two absorber pipes.
Like parabolic troughs, Fresnel reflectors are usually aligned in the north-south axis and rotate about the axis during the day for maximal efficiency (interestingly enough, however, some of the current Fresnel plants I found on Google Maps do not stick to this rule -- I couldn't help wondering the rationale behind their design choices). Unlike parabolic troughs, however, the reflectors hardly face the sun directly, as they have to bounce sunlight to the absorber pipe. The reflectors to the east of the absorber start the day with a nearly horizontal orientation and then gradually turn to face west. Conversely, those to the west of the absorber start the day with an angle that faces east and then gradually turn towards the horizontal direction. Due to the cosine efficiency similar to the optics related to heliostats for power towers, the reflectors to the east collect less energy in the morning than in the afternoon and those to the west collect more energy in the morning and less in the afternoon.

Like heliostats for power towers, Fresnel reflectors have both shadowing and blocking losses (Figure 3). Shadowing losses occur when a part of a reflector is shadowed by another. Blocking losses occur when a part of a reflector that receives sunlight cannot reflect the light to the absorber due to the obstruction of another reflector. In addition, Fresnel reflectors suffer from edge losses -- the focal line segments of certain portions near the edges may fall out of the absorber tube and their energy be lost, especially when the sun is low in the sky. In the current version of Energy3D, edge losses have not been calculated (they are relatively small compared with shadowing and blocking losses).

Linear Fresnel reflectors can focus light on multiple absorbers. Figure 4 shows a configuration of a compact linear Fresnel reflector with two absorber pipes, positioned to the east and west of the reflector arrays, respectively. With two absorber pipes, the reflectors may be overall closer to the absorbers, but the downside is increased blocking losses for each reflector (Figure 5).

Wednesday, July 12, 2017

Simulation-based analysis of parabolic trough solar power plants around the world

Fig. 1: 3D heat map of the Keahole Plant in Hawaii
Fig. 2: SEGS-8 in California and NOOR-1 in Morocco
In Version 7.1.7 of Energy3D, I have added the basic functionality needed to perform simulation-based analysis of solar power plants using parabolic trough arrays. These tools include 24-hour yield analysis for any selected day, 12-month annual yield analysis, and the 3D heat map visualization of the solar field for daily shading analysis (Figure 1). The heat map representation makes it easy to examine where and how the design can be optimized at a fine-grained level. For instance, the heat map in Figure 1 illustrates some degree of inter-row shadowing in the densely-packed Keahole Solar Power Plant in Hawaii (also known as Holaniku). If you are curious, you can also add a tree in the middle of the array to check out its effect (most solar power plants are in open space with no external obstruction to sunlight, so this is just for pure experimental fun).
Fig. 3: Hourly outputs near Tuscon in four seasons

Fig. 4: Hourly outputs near Calgary in four seasons
As of July 12, I have constructed the Energy3D models for nine such solar power plants in Canada, India, Italy, Morocco, and the United States (Arizona, California, Florida, Hawaii, and Nevada) using the newly-built user interface for creating and editing large-scale parabolic trough arrays (Figure 2). This interface aims to support anyone, be she a high school student or a professional engineer or a layperson interested in solar energy, to design this kind of solar power plant very quickly. The nine examples should sufficiently demonstrate Energy3D's capability of and relevance in designing realistic solar power plants of this type. More plants will be added in the future as we make progress in our Solarize Your World Initiative that aims to engage everyone to explore, model, and design renewable energy solutions for a sustainable world.
Fig. 5: Hourly outputs near Honolulu in four seasons

An interesting result is that the output of parabolic troughs actually dips a bit at noon in some months of the year (Figure 3), especially at high altitudes and in the winter, such as Medicine Hat in Canada at a latitude of about 51 degrees (Figure 4). This is surprising as we perceive noon as the warmest time of the day. But this effect has been observed in a real solar farm in Cary, North Carolina that uses horizontal single-axis trackers (HSATs) to turn photovoltaic solar panels. Although I don't currently have operation data from solar farms using parabolic troughs, HSAT-driven photovoltaic solar arrays that align in the north-south axis work in a way similar to parabolic troughs. So it is reasonable to expect that the outputs from parabolic troughs should exhibit similar patterns. This also seems to agree with the graphs in Figure 6 of a research paper by Italian scientists that compares parabolic troughs and Fresnel reflectors.

The effect is so counter-intuitive that folks call it "Solar Array Surprises." It occurs only in solar farms driven by HSATs (fixed arrays do not show this effect). As both the sun and the solar collectors move in HSAT solar arrays, exactly how this happens may not be easy to imagine at once. Some people suggested that the temperature effect on solar cell efficiency might be a possible cause. Although it is true that the decrease of solar cell efficiency at noon when temperature rises to unfavorable levels in the summer of North Carolina can contribute to the dip, the theory cannot explain why the effect is also pronounced in other seasons. But Energy3D accurately predicts these surprises, as I have written in an article about a year before when I added supports for solar trackers to Energy3D. I will think about this more carefully and provide the explanation later in an article dedicated to this particular topic. For now, I would like to point out that Energy3D shows that the effect diminishes for sites closer to the equator (Figure 5).

Friday, June 30, 2017

Modeling parabolic troughs in Energy3D

Fig. 1. The absorber tube of a parabolic trough

A parabolic trough is a type of concentrated solar collector that is straight in one dimension and curved as a parabola in the other two, lined with mirrors. Sunlight that enters the trough is focused on an absorber tube aligned along the focal line of the parabola, heating up the fluid in the tube (Figures 1 and 2). If the parabolic trough is for generating electricity, the heated fluid is then used to vaporize water and drive a turbine engine. A power plant usually consists of many rows of parabolic troughs.

Fig. 2. A view from the absorber tube.
Parabolic troughs are another common form of concentrated solar power (CSP), in addition to solar power towers that Energy3D has already supported (there are two other types of CSP technologies: Dish Stirling and Fresnel reflectors, but they are not very common). According to Wikipedia, there are currently more parabolic trough-based CSP plants than tower-based ones.

In the latest version of Energy3D (V7.0.6), users can now add any number of parabolic troughs of any shape and size to design a solar thermal power plant.

Fig. 3: Parabolic troughs at different times of the day

Parabolic troughs are most commonly aligned in the north-south axis so that they can rotate to track the sun from east to west during the day. This kind of trackers for parabolic troughs works in a way similar to the horizontal single-axis tracker (HSAT) for driving photovoltaic solar panel arrays. You can observe their motions when you change the time or date or animate the movement of the sun in Energy3D. Figure 3 illustrates this.

Like photovoltaic solar panel arrays, parabolic troughs have the inter-row shadowing problem as well. So the distance between adjacent rows of parabolic troughs cannot be too small, either. But unlike solar power towers, parabolic troughs do not have reflection blocking issues among mirrors. Figure 4 shows this.

This new addition greatly enhances Energy3D's capability of modeling CSP plants, moving the software closer to the goal of being a one-stop shop for exploring all sorts of solar solutions. In the coming weeks, we will start to build 3D models for parabolic troughs in the real world.
Fig. 4: Inter-row shadowing in parabolic trough arrays

Thursday, June 22, 2017

Khi Solar One

Khi Solar One (KSO) is a 50 MW solar power tower plant located in Upington, South Africa, which was commissioned in February, 2016. KSO has 4,120 heliostats on 346 acres of land. Each heliostat is as large as 140 square meters, reflecting sunlight to a tower as tall as 205 meters. KSO has two hours of thermal storage. The power plant is expected to generate a total of 180 GWh per year.

A low-resolution simulation of Energy3D predicts that on February 28 (close to when the Google Maps image was most likely taken) and June 28 (a winter day in the southern hemisphere), the total daily input to the solar tower (not the output of electricity generated by the turbines) is about 2.6 MWh and 1.9 MWh, respectively, as is shown in the graphs below.

The Energy3D model of the KSO can be downloaded from this web page, along with other solar power plants.


Friday, June 16, 2017

Creating computer models for all solar thermal power plants in the world

Fig. 1: Energy3D models for six solar power towers
Fig. 2: The Gemasolar Plant
One of the unique features of Energy3D is its ability to model, design, and simulate solar power towers. Figure 1 shows the Energy3D models for six solar power towers: Gemosolar (Spain), PS10 (Spain), PS20 (Spain), Greenway (Turkey), Themis (France), and Badaling (China). To support the research and development on concentrated solar power (CSP) -- a solar power solution alternative to photovoltaic (PV) arrays that may be able to provide some baseload capacity, I have been working on creating a library of 3D models for all the existing and planned solar thermal power plants in the world. The ultimate goal is to develop Energy3D into a versatile CAD tool for all forms of CSP (and PV), based on accurate simulation of existing plants first. The acquisition of the capability of reliably modeling both CSP and PV will enable Energy3D to truly support our Solarize Your World Initiative.

Fig. 3: The Gemasolar Plant
Fig. 4: The Gemasolar plant (June 30)
This article shows a bit of progress towards that goal. I have recently added in Energy3D weather data for scores of sites that already have CSP plants or are planning to build CSP plants. Many of these new sites are in Africa, China, Europe, and South America (some of them were requested by our users in Algeria and Chile). These newly added locations bring the total number of sites supported in Energy3D to more than 250. This growing network should provide you weather data that are approximately applicable to your site (but let me know if your site is not currently covered by Energy3D to your satisfaction). When you import your Earth view in Energy3D, the software will automatically choose the supported location that is closest to your site. If there is already a power tower, you can use the length and direction of its shadow in the picture to estimate the date and time when the picture was taken -- this can be done by turning on the shadow and adjusting the date and time spinner of Energy3D until the calculated shadow approximately aligns with the real shadow. After this is done, the heliostats that you add to the scene will approximately point to the same direction as in the image.

In this article, I picked the impressive Gemosolar Thermosolar Plant near the city of Seville, Spain as a showcase. The plant has 2,650 heliostats on 520 acres of land, each of which is as large as 120 square meters. The tower is 140 meters tall. The annual output is approximately 110 GWh. With molten salt tanks, it can store up to 15 hours of energy. Using a low-resolution setting, it takes Energy3D 5-10 minutes to complete a daily simulation and up to a couple of hours to complete an annual simulation. If you can afford to wait longer, you can always increase the simulation resolution and improve the accuracy of results (e.g., more points on the reflectors better account for blocking and shadowing losses).

Wednesday, May 24, 2017

A Mickey Mouse-shaped solar farm

Fig. 1: An aerial view of the Mickey Mouse-shaped solar farm
Fig. 2: An Energy3D model of the Mickey Mouse-shaped solar farm
If I didn't tell you that this is an actual solar farm near the Epcot Theme Park in the Disney World in Orlando, Florida, you probably would think this is some kind of school project done by kids. But no, this 22-acre 5 MW project was designed and installed by Duke Energy and it has been powering Disney World's facilities since 2016 (Figure 1 is an image from Disney.com). So this is some kind of serious business and has drawn a lot of media attention. The solar farm is so new that even the latest version of Google Maps in May 2017 still does not show it (it is available through Google Maps API that we are using, though).

By shaping the beloved Mickey Mouse character with tens of thousands of solar panels, Disney World has delivered a strong message to the world that the company is committed to a sustainable future.

Fig. 3: A solar radiation heat map representation (June 22).
But who says that kids should not do this? Perhaps they couldn't do it because of the lack of appropriate support and tool. Not any more. Thanks to the support from the National Science Foundation, our powerful Energy3D software and our Solarize Your World curriculum can probably turn every wild imagination in solar power into virtual reality, particularly for children who may need more inquiry- and design-based activities that connect so deeply to their world and their future. Figure 2 shows a model of the Mickey Mouse-shaped solar farm in Energy3D and Figure 3 shows a heat map representation of the solar radiation onto the solar panel arrays.