Sunday, July 31, 2016

Modeling dual-axis solar trackers in Energy3D

Fig. 1: Solar panel arrays in Energy3D
A solar tracker is a system that automatically turns a solar panel or a reflector toward the sun in order to maximize the energy output of a solar power station. It is often said to be inspired by the sunflower.

In general, trackers can be categorized into two types: single-axis trackers and dual-axis trackers. Single-axis trackers have one degree of freedom that acts as an axis of rotation. The axis of rotation of single-axis trackers typically points to true north. Dual-axis trackers, on the other hand, have two degrees of freedom that act as axes of rotation. These axes are typically perpendicular to each other such as those in the altazimuth system. Single-axis trackers cannot exactly follow the sun but dual-axis trackers can.

Dual-axis trackers have been implemented in our Energy3D software for photovoltaic (PV) solar panels, as is shown in the video embedded in this post.

Energy3D has a variety of built-in tools for creating PV array layouts and analyzing their daily and annual yields. Figure 2 shows the comparison of the output of a solar panel rotated by a dual-axis tracker and those of solar panels fixed at different tilt angles (0°, 15°, 30°, 45°, 60°, 75°, and 90°) on March 22, June 22, September 22, and December 22, respectively, in Boston, MA. Not surprisingly, the result shows that the solar panel produces the most energy in June and the least in December.

Fig.2 A tracking PV panel vs. fixed panels at different tilt angles
When analyzing the benefit of using a solar tracker, we found that in June, a fixed panel at the optimal tilt angle produces about 70% of the energy produced by a panel oriented by a dual-axis tracker. That percentage increases to about 75% in March and September and to about 90% in December. This means that the benefit of using a tracker, compared with the maximal output of a fixed panel with the optimal tilt angle, will be significant in the summer but gradually diminish when the winter comes.

Having to manually adjust the tilt angles for a lot of solar panels four times a year sounds like too laborious to be practical. If that is out of the question, it would then be fair to compare the output of a solar panel with a tracker and those fixed at the same tilt angle throughout the year. Figure 3 shows that the total annual yield of a solar panel at the best tilt angle produces only 70% of the energy produced by a solar panel rotated by a tracker. In other words, a solar panel rotated by a tracker generates about 42% more energy compared with a solar panel fixed at the optimal tilt angle on the annual basis.
Fig.3 Annual outputs: tracker vs. fixed

Does the additional energy that solar trackers help generate worth the money (initial investment plus maintenance of moving parts) they cost? You may have heard that, as solar panels get cheaper and cheaper, trackers become less and less favorable. I want to offer a different point of view.

Surely, the return of the investment on solar trackers depends on a number of factors such as the price of solar panels. But one of the most important factors is the solar cell efficiency of the solar panels they rotate. The higher the efficiency is, the more the extra electricity a tracker can yield to offset the cost and make a profit. With the solar cell efficiency for commercial panels breaks record every year (reportedly 31.6% in July 2016), what didn't make economic sense in the past looks lucrative now. The future of the market for solar trackers will only look brighter.

Friday, July 22, 2016

Solar Engineering Summer Camp 2016


Computer modeling with Energy3D
The free Solar Engineering Summer Camp offered by the Concord Consortium was an intensive week-long event that focused on learning and applying solar science, 3D modeling, and engineering design. It featured a solar engineer from a leading solar company as a guest speaker. The activities included hands-on and computer-based activities that were designed to inspire and empower children to solve real-world problems and become change makers who will hopefully create a more sustainable future.

Poster session with parents
This year, eleven children (age 11-16) participated in the event that took place on Concord Consortium's east coast campus. Participants became the science advisors for their parents, investigating how their own houses could be turned into a small power station that supplies the energy needed.

A 3D house created and studied in the event
Using Google Earth and our Energy3D software, they made 3D computer models of their own houses, designed different solar array layouts, and then ran computer simulation to evaluate and compare their yields. They performed cost-benefit analysis of different solutions, based on which they completed solar assessment reports about the solarization potential of their own homes. At last, they presented their results in a poster session and discussed their findings with their parents.

The parents were generally very supportive. Some even helped their kids measure the dimensions of their houses (unfortunately, Google Earth does not provide sufficient information for students to retrieve the geometry of their houses; so some kids must learn how to measure the heights of their roofs using other methods such as photogrammetry).

3D houses created by kids
How did the little science advisors do their jobs in terms of informing their parents then? When asked "Did your child’s Solar Assessment Report make you change your view or interest in solar energy?", a parent responded in the exit survey: "We already have solar panels on our house. This project allowed me to consider our energy needs and additional options for increasing our capacity to generate electricity." This example shows that even for those people who already have solar panels on their roofs, the findings from their kids might have spurred them to think about more possibilities.

As a side note, I noticed an interesting response from a parent: "She enjoyed using the software to design our house. She said it was an interesting topic, but she cautioned me not to rely solely on her calculations to base our decision on whether to convert to solar energy use for our house." The kid is right -- all models have limitations and engineers must use caution. A science advisor should inform her advisee that a model may fail.

Wednesday, July 13, 2016

Simulating concentrated solar power towers with Energy3D

Concentrated solar power (CSP) systems generate electricity using arrays of mirrors to concentrate sunlight shed on a large area onto a small area. The concentrated light is converted into thermal energy, which then drives a heat engine connected to an electrical power generator. Put it simply, a CSP power station operates like a solar cooker that you might have made in a high school science project. You can think of it as a gigantic solar cooker.

But a small science idea like this could turn into big money. For example, the Ivanpah Solar Power Facility in the California Mojave Desert, which drew $2.2 billion of investment, generates 392 megawatts (MW) -- enough to power hundreds of thousands of homes. As of 2016, the largest CSP project in the world is the Ouarzazate Solar Power Station in Morocco, which is expected to output 580 MW at peak and cost about $9 billion. Globally, CSP power stations will generate 4,705 MW this year.

CSP stations do not need to be only large-scale. Small-scale CSP stations (below 1 MW, on-grid or off-grid) may provide more flexible and affordable solutions to communities, especially those in rural areas. They provide attractive alternatives to photovoltaic power stations. Reflecting mirrors would probably cost less and last longer than solar panels and there is little to no concern of outdated or degraded efficiency (reflectivity loss may be less than 1% after 10 years of exposure to UV). The latter is an issue for solar panels if you consider that, in just six years, the latest 24.1% of solar cell efficiency of commercial panels in 2016 (UPDATE: In July, Hanergy debuted the 31.6% efficiency solar cells for their solar cars!) almost render those 12%-efficiency panels installed in 2010 obsolete and more breakthroughs forecast down the road will only make the old ones look less pretty.

To support the exploration of all kinds of solar energy exploitation, we have added the initial capacity to model CSP power stations in our Energy3D software, which is intended to be a "one-stop-shop" for solar energy modeling and design. This includes the capability of adding mirrors, heliostats, and power towers and analyzing the outputs as a function of time, location, and weather. This article shows some of the graphic effects of solar power towers (with more than 500 reflectors, each of which has the size of 2 by 3 meters, amounting to a total reflective area of more than 3,000 square meters). The four images above demonstrate how heliostats change the orientations of the reflectors at different times of the day (the selected date is June 22 and the selected location is Phoenix, AZ). The images show a simple circular field layout. In reality, radial stagger layouts that minimize shadow loss and block loss and maximize cosine efficiency are commonly used.

In the months to come, we plan to enhance Energy3D's ability to support a variety of field layout designs for power towers and model various configurations of solar thermal power (e.g., parabolic trough, parabolic dishes, and Fresnel reflectors).

I have blogged about Energy3D's capacity to simulate large-scale photovoltaic power stations. This new capacity of simulating CSP stations has enabled Energy3D to model and design two of the three main types of solar power plants (the remaining one is solar updraft tower, or solar chimney, which you will also be able to model in Energy3D in the future).

Updates:

Monday, July 11, 2016

Integrating Solarize Mass and STEM education through powerful simulation technologies

Fig.1: Solar simulation in Energy3D.
Solarize Mass is a program launched by the Massachusetts Clean Energy Center that seeks to increase the adoption of small-scale solar electricity in participating communities. In 2016, the towns of Natick and Bolton were selected to pilot for Solarize Mass. According to the Town of Natick, "Solarize Mass Natick is a volunteer initiative run by Natick residents. Our goal is to make going solar simple and affordable for Natick residents and small business owners as part of a 2016 state-sponsored program. But it is a limited-time program: the deadline for requesting a site visit is August 1, 2016."

Solar energy does not need to be a limited-time offer. The question is to figure out how residents can do their own site assessment while the guys are not in town to give free consultation. Sure, residents can use Google's Sunroof to quickly check whether solar is right for them (if their areas are covered by Sunroof). But what Sunroof does is only to screen a building based on its solar potential, not to provide a more informative engineering solution to help homeowners make up their minds. The latter has to be done by a solar installer who will provide the PV array layout, the output projection, the financial analysis, etc., in order to run a convincing business. But this is a time-consuming process that poses financial risks to solar installers if the homeowners end up backing out. So we need to find some other creative solutions.

Fig. 2: Student work from a Massachusetts school in 2016.
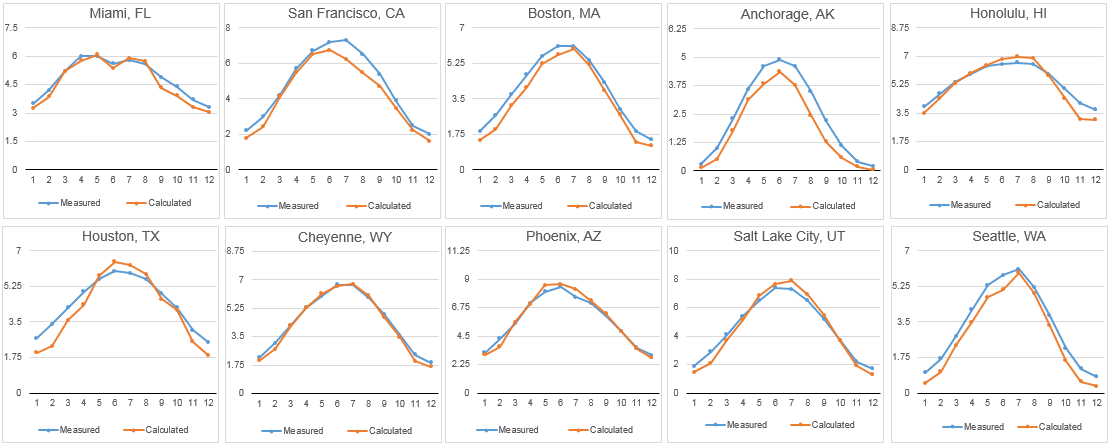
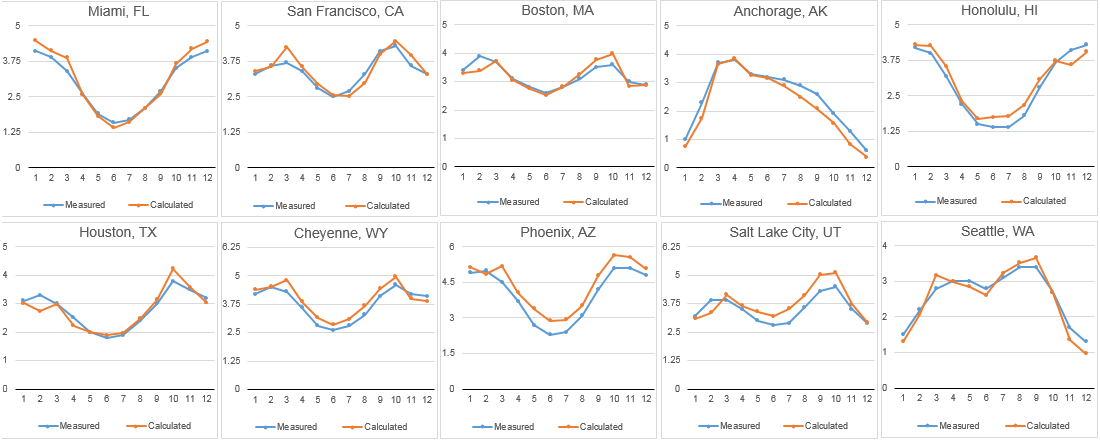
Funded by the National Science Foundation (NSF), we have been working at the Concord Consortium on exploring meaningful ways to combine solar programs with STEM education that will effectively boost each other. We have been developing a powerful computer-aided engineering system called Energy3D that essentially turns an important part of solar engineering's job into something that even a middle or high school student can do (Figure 1). In a recent case study, we found that Energy3D's prediction outperforms a solar installer's prediction for my colleague's house in Bolton, MA. In a pilot test in an Eastern Massachusetts school in June 2016, we found at least 60% of the 27 ninth graders who participated in the 8-hour activity succeeded -- with various degrees -- in coming up with a 3D model of her/his house and designing a solarization solution based on it (Figure 2). Giving the fact that they had to learn both Google Earth and Energy3D in a very short time and then perform a serious job, this result is actually quite encouraging. Our challenge in the NSF-funded project is to improve our technology, materials, and pedagogy so that more students can do a better job within a limited amount of time in the classroom.

With this improving capacity, we are now asking this question: "What can middle or high school students empowered by Energy3D do for the solarization movement?" Fact is that, there are four million children entering our education system each year in the US. If 1% of them become little solar advocates or even solar engineers in schools, the landscape for green energy could be quite different from what it is now.

Fig. 3: Energy3D supports rich design.
Starting from three years ago, STEM education in the US is required to incorporate science and engineering practices extensively into the curriculum by the Next Generation Science Standards (the equivalent of Common Core for science). The expectation is that students will gradually think and act like a real scientist and engineer through their education careers. To accomplish this goal, an abundance of opportunities for students to practice science and engineering through solving authentic real-world problems will need to be created and researched. On July 8, 2016, NSF has also made this clear in the a proposal solicitation letter about what they call Change Makers, which states: "Learners can be Change Makers, identifying and working to solve problems that matter deeply to them, while simultaneously advancing their own understanding and expertise. Research shows that engaging in real world problem solving enhances learning, understanding, and persistence in STEM." Specifically, the letter lists "crowd-sourced solutions to clean energy challenge through global, public participation in science" as an example topic. An NSF letter like this usually reflects the thinking and priority of the funding agency. From a practical point of view, considering the fact that the choices for engineering projects for schools are currently quite limited, there is a good chance that schools would welcome solar engineering and other types of engineering as an alternative to, say, robotic engineering.

The overlap of timing for the ongoing solarization movement and the ongoing education overhaul poses a great opportunity for uniting the two fronts. We envision that Energy3D will play a vitally important role on making this integration a reality because 1) Energy3D is based on rigorous science and engineering principles, 2) its accuracy is comparable to that of other industry-grade simulation tools, 3) it simulates what solar engineers do in the workplace, 4) it covers the education standards of scientific inquiry and engineering design, 5) it supports many architectural styles (Figure 3), 6) it works just like a design game (e.g., Minecraft) for children, and 7) last but not least -- it is free! With more development under way and planned for the future, Energy3D is also on the way to become a citizen science platform for anyone interested in residential and commercial solar designs and even solar power plant designs.

Exactly how the integration will be engineered is still a question under exploration. But we are very excited about all the possibilities ahead and we are already in an early phase to test some preliminary ideas. If you represent a solar company and are interested in this initiative, please feel free to contact us.

Friday, July 1, 2016

Comparing Energy3D's prediction of solar panel yields with real data from a house in Massachusetts

Fig. 1: Street view before solar panel installation
How accurately can Energy3D predict the energy generated by solar panels? This is critical for Energy3D as our goal is to provide a reliable engineering tool for modeling and designing solar energy applications. Even if our primary target users are students, there is no room for complacency, simply because engineering is all about accuracy and it is important that we pass this spirit to the next generation.

Fig. 2: Comparing predicted and real data
We have compared Energy3D's results with sensors placed on the horizontal plane and the vertical south-facing plane and concluded that Energy3D predicts satisfactory results. But we haven't compared Energy3D's predictions with output data from real solar panels.

My colleague Dan Damelin of the Concord Consortium has recently had solar panels installed for his house (Figure 1 shows his house before solar panels were installed). His solar system, which consists of 34 SunPower panels estimated to have a total power output of 11 kW, went into operation last December. By the time I am writing this blog post, he has accumulated six months of data, providing a good basis for a case study. So I asked our summer intern, Guanhua Chen, a PhD student from the University of Miami, to conduct a case study that uses Energy3D to analyze Dan's solar system.

The solar company that Dan hired came to his house, surveyed the site, and gave him a proposal that detailed the layout of the 34 panels. They also provided him a projection of monthly outputs, juxtaposed with his monthly electricity bill. The solar company's estimate is shown in Figure 2 as the gray line, whereas the bar graph represents the monthly electricity usages.

Fig. 3: An Energy3D model of the house
Guanhua used Energy3D to create a 3D model of the house and put 34 SunPower panels following the actual layout done by the solar installer (Figure 3). The dimension of the SunPower panels is slightly different from that of most other brands (which is approximately 3 by 5 feet). They have great solar cell efficiency, which is about 21% -- one of the highest in the market.

Comparing with the real production data from December to June (represented by the red line in Figure 2), the solar company's projection overestimates a bit of the yields in the winter months but significantly underestimates those in the summer months. By comparison, Energy3D's predictions (represented by the green line) for the spring and summer months agree much better with the real data. Like the solar company's predictions, Energy3D seems to overestimate the winter production. This may be due to the fact that we haven't incorporated the effect of snow and ice in the simulation core of Energy3D. Should we factor this effect in the calculation, the results would be more accurate. In our next iteration of the computational core, we will build a mathematical model of the snow effect.

If Energy3D can outperform the production software used by the solar installer in this case -- as Figure 2 seems to suggest, the implication could be enormous, because this is a free tool so easy that every student can use. With it, we now have a serious chance to engage and enable students to solve critical energy problems. And there are million of students out there! If a fraction of them can be turned into little solar engineers by Energy3D,  the world could be a better place sooner.